Server Mode
The server command starts a web server on a local port to provide a user interface for browsing through the run data captured by record and run. It connects to the same database, so as new runs are captured they appear in the user interface.
Run List
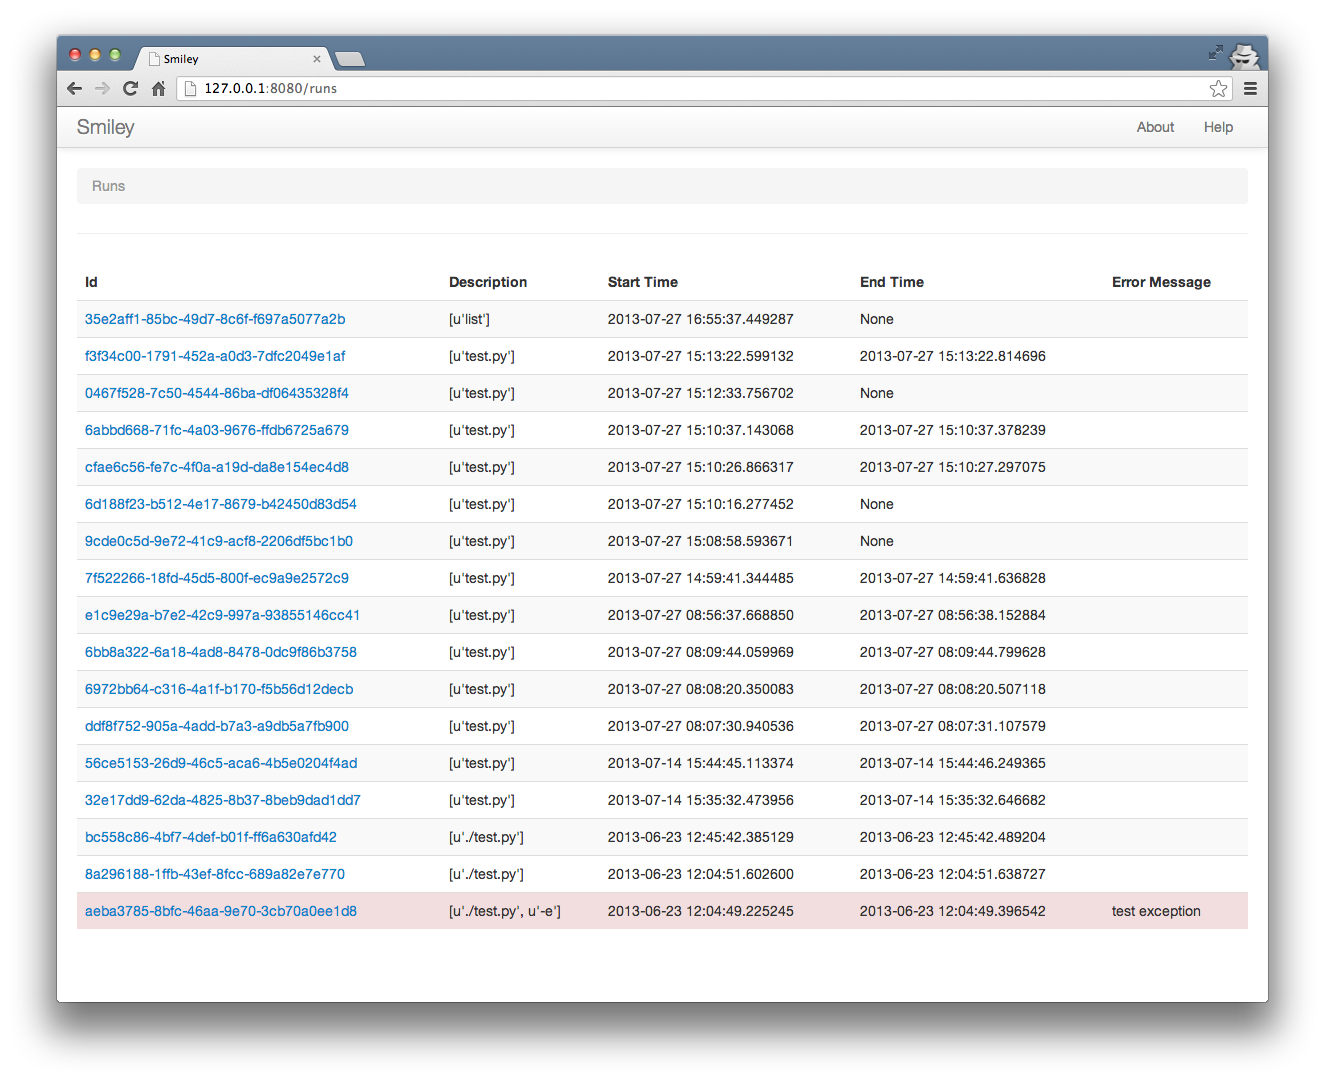
The server listens on http://127.0.0.1:8080 by default. Visiting
that page in a browser causes the server to return a list of the runs
found in the database in reverse chronological order. For each run the
list shows its id, “description”, start and end times, and any final
error message. Clicking the “X” link in the far left column will
permanently delete that run from the database.
Run Details
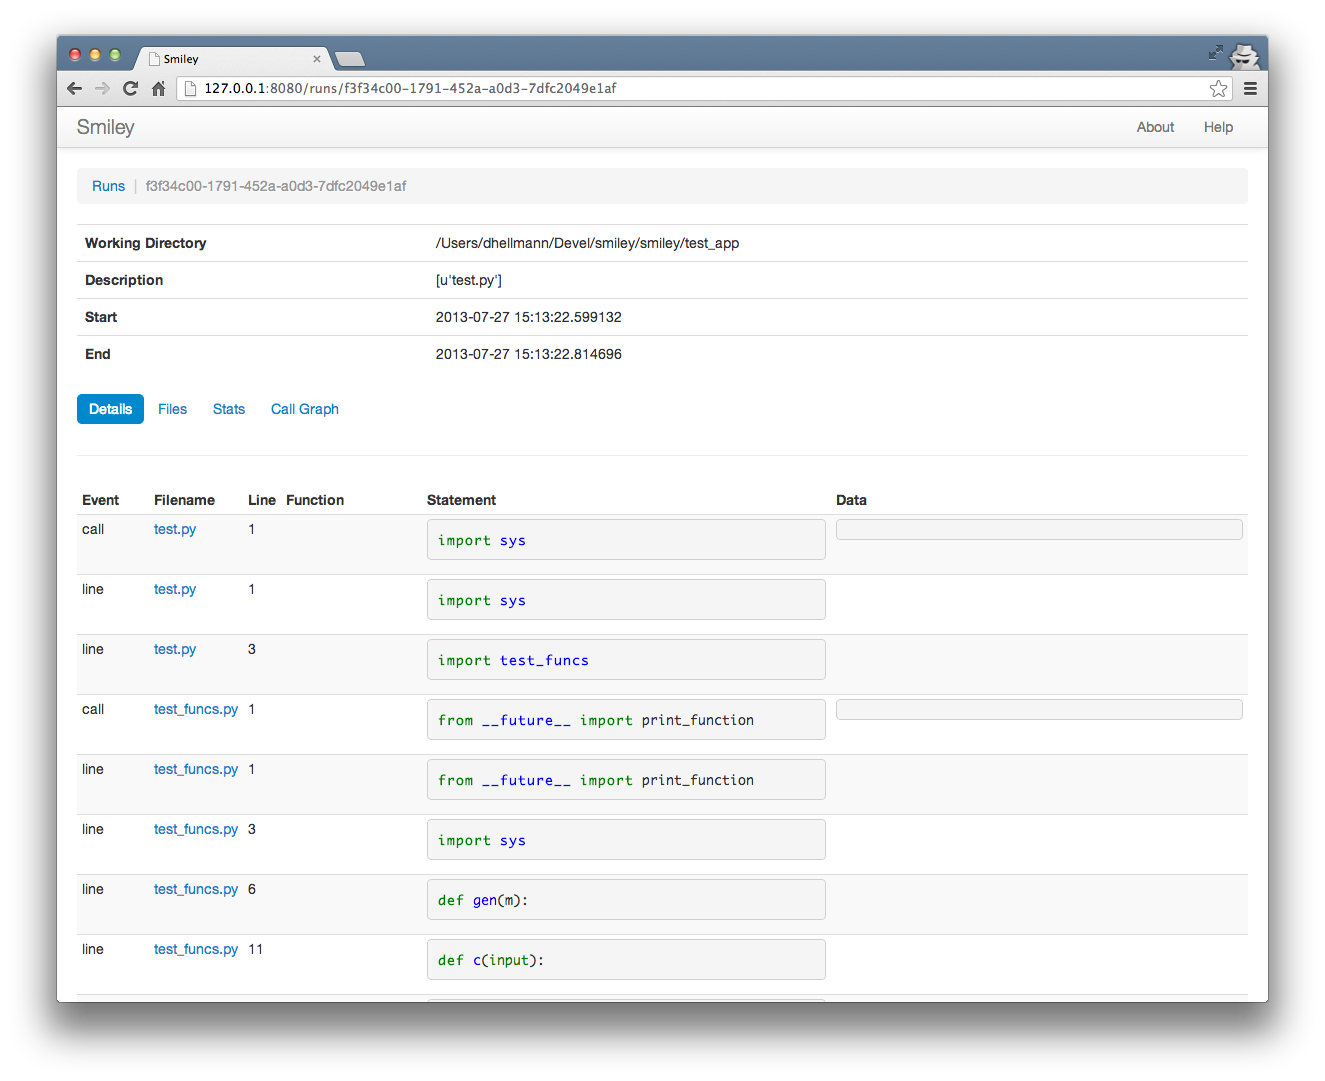
Clicking on one of the run id values opens the detailed information recorded for that run. The details page shows the state of the program line-by-line as it runs, including where the program control is (filename, line number, and source line) as well as local variables and the return values from functions. This is the same information reported by monitor and replay, in a format that is easier to read.
Source Files
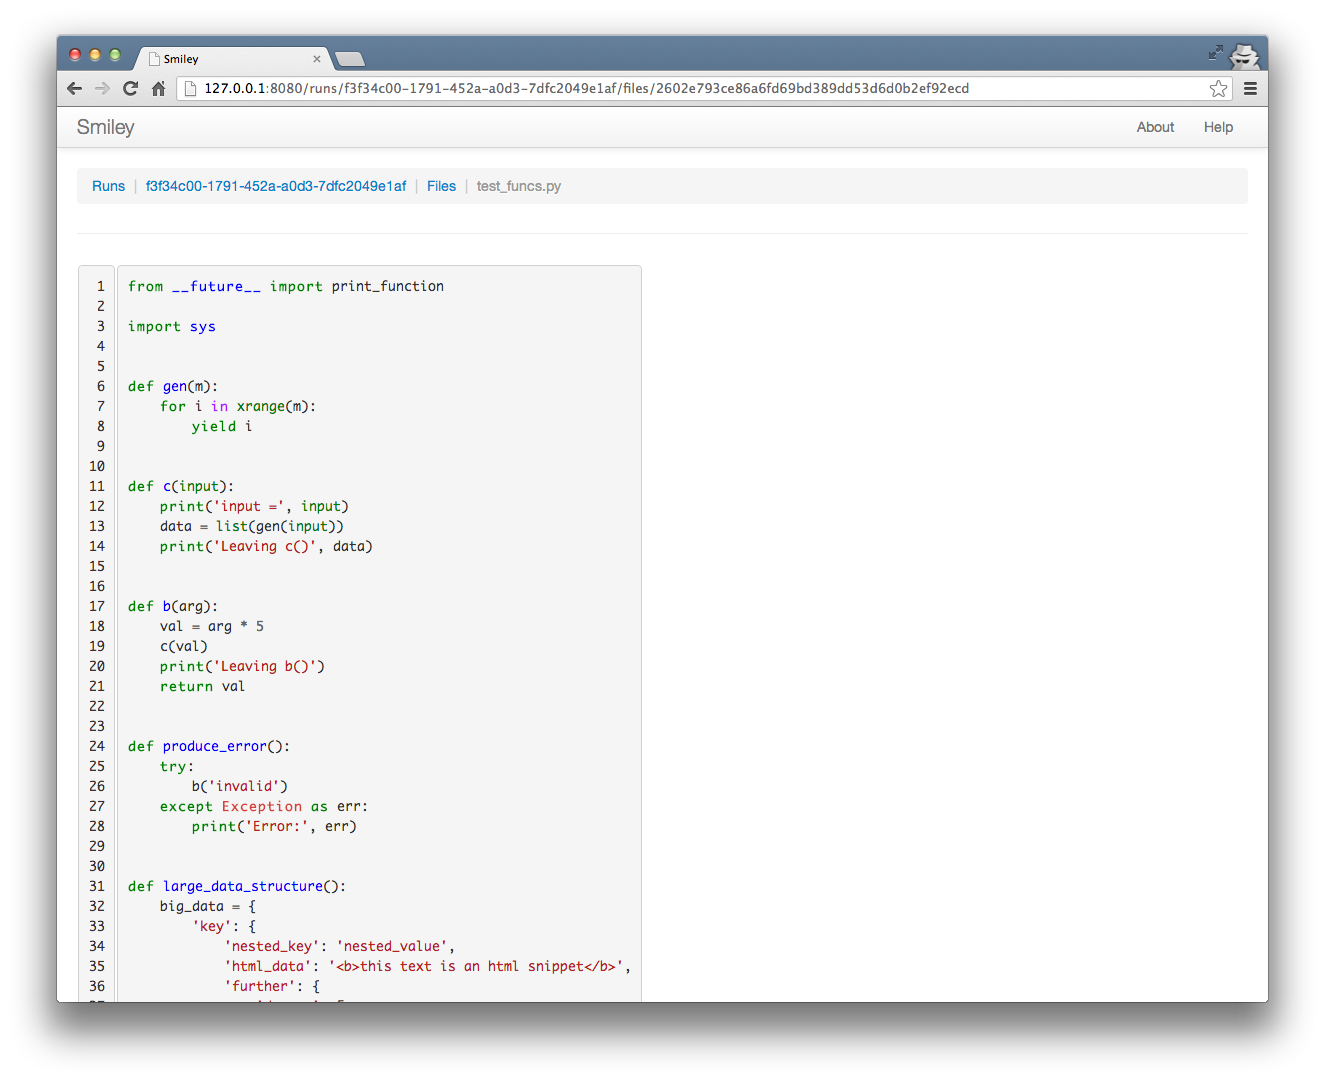
Each of the filenames in the run details view links to a page showing the full source of the Python file as it was at the time of the program’s execution.
File List
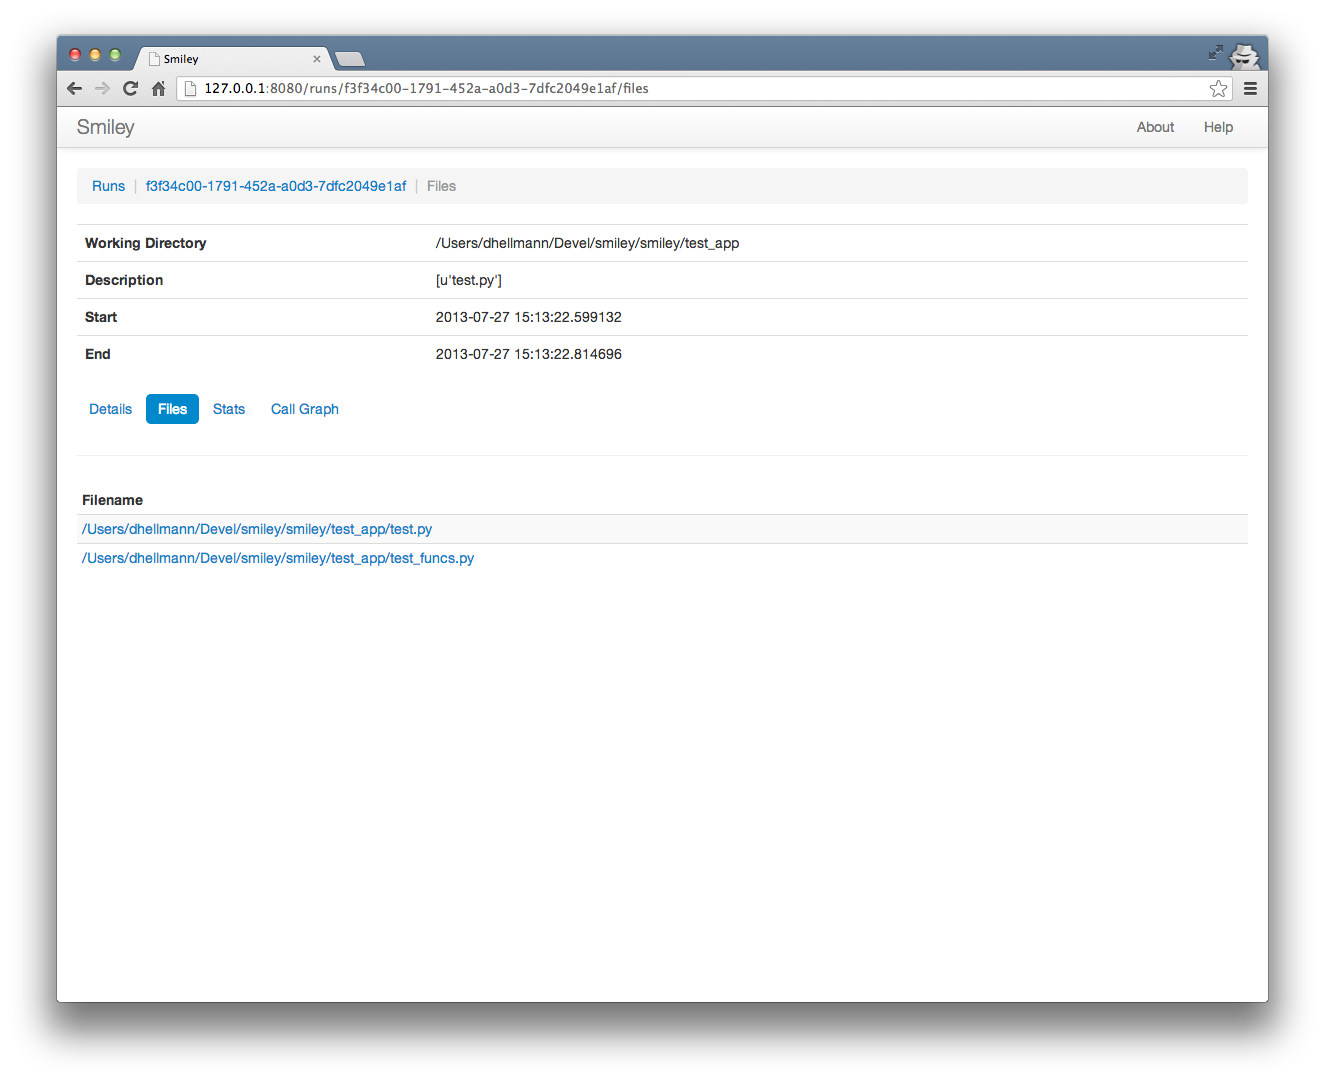
For an application with many source files, it may be more convenient to examine the source by navigating to the file list view and choosing the file from the list.
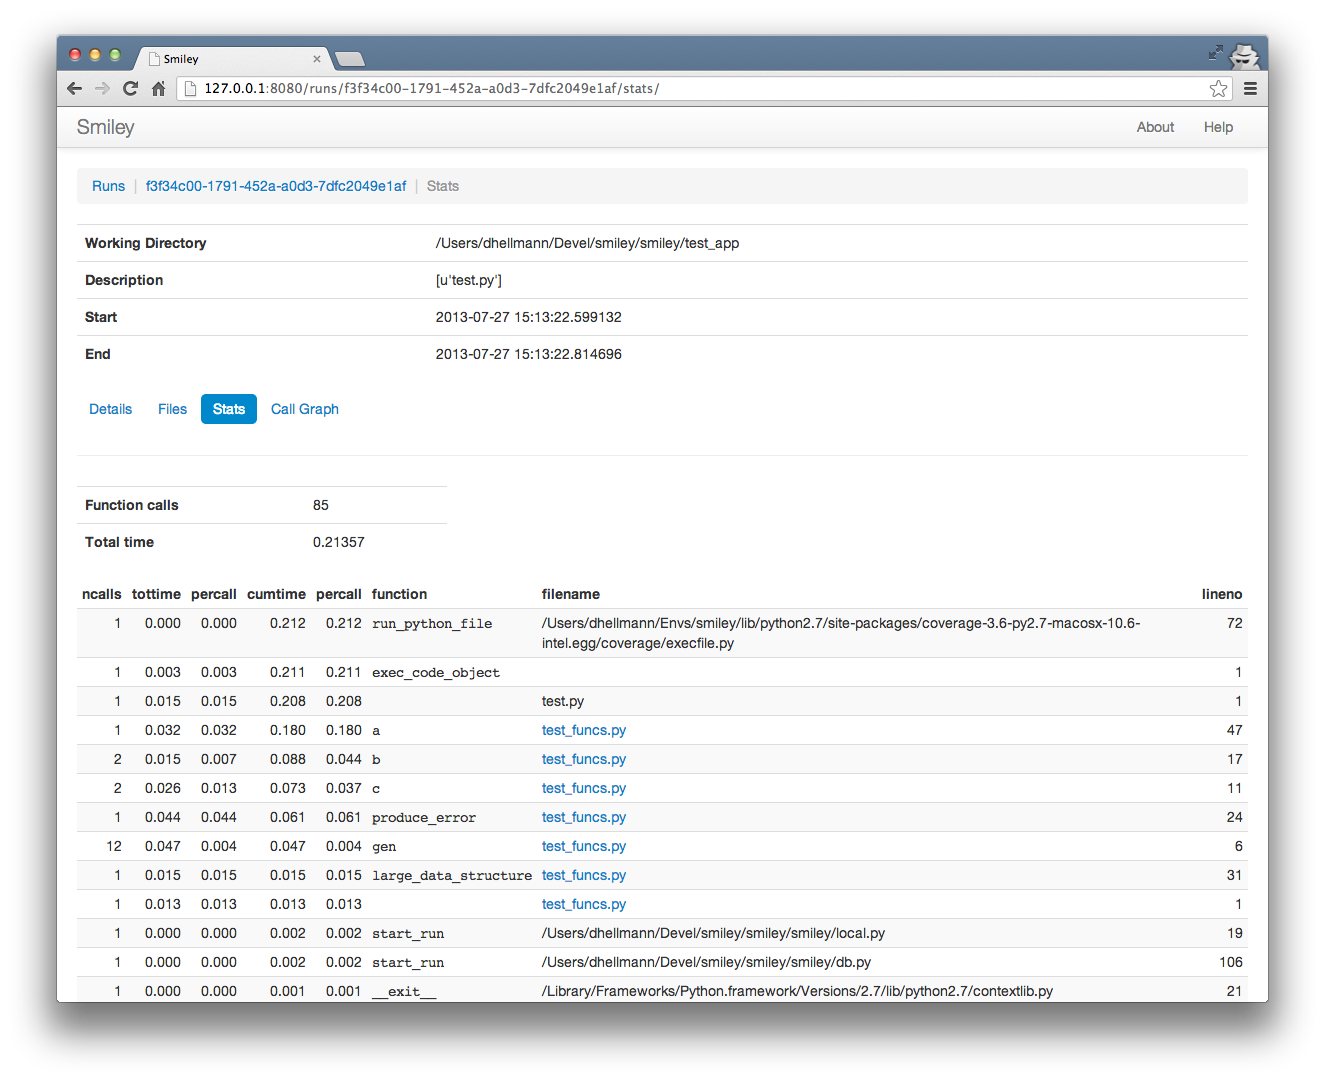
Profiler Statistics
The stats view shows the profiler output for the run, sorted by cumulative time. As with the run details, each file name links to the full source for the module.
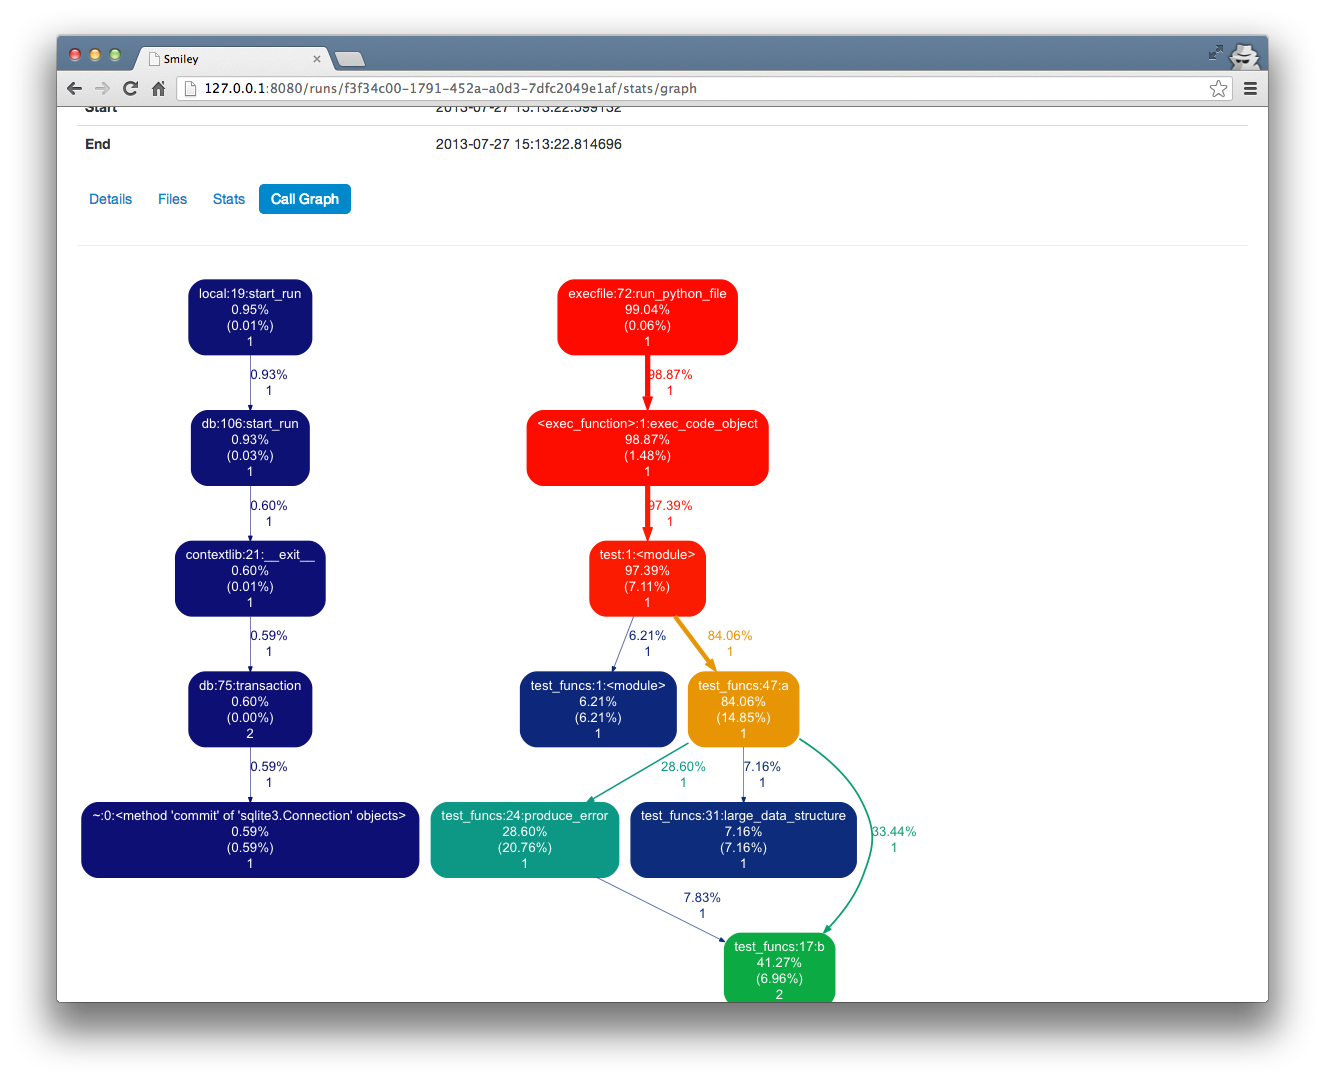
Call Graph
The call graph view uses gprof2dot and graphviz to produce a tree diagram showing how much time is used in different parts of the program, to make it easier to focus on the areas that use the most time.
Note
In order for this page to work, you must have the dot command
installed. Installing smiley should install gprof2dot
automatically.